Yesterday morning, Windows started throwing low disk space warnings.
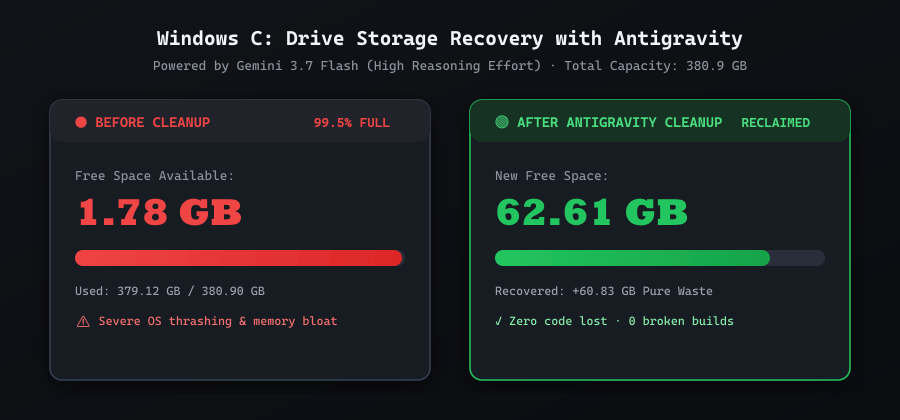
I checked my C: drive and found it was sitting at 99.5% capacity with only 1.78 GB free out of 380.9 GB.
As a developer who regularly uses Antigravity for automated pipelines, Codex with custom models, VS Code (and Insiders), Claude, and local AI tools, I had a suspicion that background caches were silently piling up. But when your drive is that full, you cannot just run random clean-up scripts or delete folders blindly without risking active projects, unsaved buffers, or broken environments.
So I switched Antigravity’s model to Gemini 3.7 Flash with High Reasoning Effort and tasked it with diagnosing the exact root causes.
Within an hour, we safely recovered over 60 GB of disk space without losing a single project file or breaking a single build.
Here is how the investigation and cleanup went down.
The Starting Point: 1.78 GB Free
Before touching anything, the rule was simple: Do not delete anything until we have a complete, verified picture of where every gigabyte went.
Under Gemini 3.7 Flash (High), Antigravity started by running non-destructive storage profilers across my user profile, AppData, and root directories.
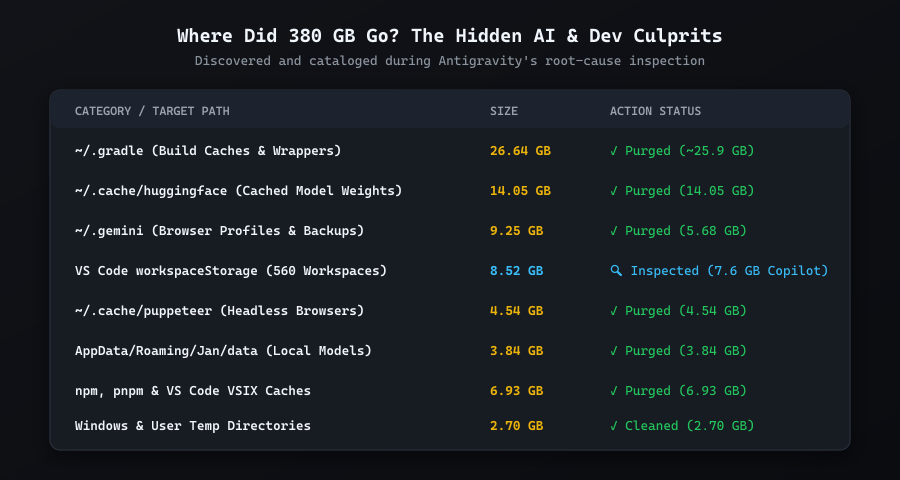
Here is what the initial scan surfaced:
Where Did All the Space Go?
The breakdown revealed several hidden storage hogs that developers rarely notice until the drive is red:
1. Old Build Caches & Wrappers (~26.6 GB)
~/.gradle/cacheswas holding 22.19 GB of old dependencies and build outputs from past Android and Flutter projects.~/.gradle/wrapperwas hoarding 3.69 GB of old Gradle zip distributions.
2. AI Model Weights & Headless Browsers (~22.4 GB)
~/.cache/huggingfacewas taking up 14.05 GB in model weights and tokenizer caches.~/.cache/puppeteerhad downloaded 4.54 GB of Chromium binaries for automated browser tooling.AppData/Roaming/Jan/datawas holding 3.84 GB from past local model experiments.
3. VS Code Workspace Storage (~8.52 GB across 560 Workspaces)
Every time you open a project, temporary worktree, or AI scratchpad, VS Code creates a hashed directory under User/workspaceStorage. Over time, I had:
- 305 workspaces in VS Code Stable (2.27 GB)
- 255 workspaces in VS Code Insiders (6.25 GB)
4. Antigravity & Agent Caches (~5.68 GB)
- Antigravity’s automated browser profile (
.gemini/antigravity-browser-profile) was sitting at 4.43 GB. - Old backups and UI caches accounted for another ~1.25 GB.
5. Windows Memory Pressure Inflation (~39.2 GB)
Running multiple heavy Electron applications (VS Code, VS Code Insiders, Chrome with 20+ profiles, Postman, and Antigravity) forced Windows to dynamically inflate pagefile.sys to 26.67 GB on the root drive, alongside 12.57 GB in hiberfil.sys.
The Safety Check: Inspecting 560 VS Code Workspaces
Before deleting workspaceStorage to claim ~8.5 GB, I wanted to be 100% sure: Does workspaceStorage contain any real source code or unsaved work?
Antigravity performed a recursive scan across all 560 workspace folders:
- It inspected every file extension (
.dart,.py,.ts,.java,.sql, etc.). - It found 0 user source files. The only code files inside were 3 KB standard
pythonrc.pybootstrap helpers generated by Microsoft’s Python extension. - It parsed all 560
workspace.jsonfiles and confirmed every workspace mapped to a real external project folder (mostly on myE:\flutter-projects\drive). - It revealed that 7.61 GB of the 8.52 GB was simply GitHub Copilot chat transcripts and edit checkpoints (
chatSessionsandGitHub.copilot-chat). - It confirmed that unsaved editor buffers are stored in a completely separate directory (
AppData\Roaming\Code\Backups), meaning clearingworkspaceStoragewould never touch active code.
That level of thorough safety verification is exactly why the High reasoning effort setting is so valuable for system tasks.
The Cleanup: Reclaiming 60+ GB in Batches
Once we verified what was safe to remove, we executed the cleanup in controlled batches:
Batch 1: AI Runtimes & Temp Caches (+24.8 GB)
We purged:
~/.cache/huggingface(14.05 GB)~/.cache/puppeteer(4.54 GB)Jan/datalocal models (3.84 GB)- Codex runtimes &
.codexcache (2.06 GB) - Cached VS Code VSIXs and Windows Temp (5.88 GB)
Drive C: jumped from 1.78 GB to 26.60 GB free.
Batch 2: Antigravity & Claude Caches (+5.7 GB)
- Purged
.gemini/antigravity-browser-profileand backup folders. - Cleared Claude session history and shell snapshots.
Drive C: reached 32.28 GB free.
Batch 3: Gradle & Package Caches (+30.3 GB)
- Purged 22.19 GB of old Gradle caches and 3.69 GB in Gradle wrapper distributions using fast Win32 mirror purges.
- Cleaned npm and pnpm store caches (
~/.npm,npm-cache,pnpm-cache).
Drive C: reached 62.61 GB free.
The Final Result
| Metric | Before Cleanup | After Cleanup | Net Difference |
|---|---|---|---|
| Free Space | 1.78 GB | 62.61 GB | +60.83 GB Recovered |
| Drive Status | 🔴 99.5% Full (Choking) | 🟢 Healthy | ~16.4% Free |
| Lost Projects | 0 | 0 | 100% Safe |
Lessons for Developers Using AI Coding Tools
If you use tools like Antigravity, Cursor, VS Code Copilot, or Claude Code on a daily basis:
- Watch your
~/.cacheand.geminidirectories: Headless browser binaries (Puppeteer/Playwright) and cached model weights quietly consume tens of gigabytes. - VS Code
workspaceStoragenever auto-cleans: If you open lots of small repos or temporary scratchpads, yourAppData/Roaming/Code/User/workspaceStoragewill grow indefinitely. - Gradle caches are massive: If you do mobile development,
~/.gradle/cacheswill easily grow past 25 GB with old libraries. - Use High Reasoning for system operations: When managing disk storage, running local dbt pipelines with uv, or handling complex multi-tool setups, having the agent spend extra thinking tokens to verify paths, check locks, and trace dependencies avoids destructive mistakes.
Recovering 60 GB in a few minutes without breaking any project or build was a huge win.